
Storm Bert: A case study navigating the truth about flooding in a changing climate

Satellite Image of Storm Bert. © Crown copyright, Met Office
In this February 2025 guest blog, Eleanor Pinches from the Royal Meteorological Society looks at Storm Bert and how climate change can be a factor in river floods.
It increasingly likely when scrolling through the latest world news to read an extreme weather headline. Looking back at 2024, numerous events lodged in my memory: severe flooding in Pakistan in February which killed at least 40 people, the earliest Category 5 storm to form in the North Atlantic hurricane season, Hurricane Beryl, in July 2024, the Greek Wildfire outbreak in August, Hurricane Helene and Hurricane Milton making landfall over the Gulf Coast of Florida in September and October together killing at least 250 people, and the devastating flooding in Spain in October. Significant events have occurred in the UK too.
UK newspapers and news bulletins have featured numerous pictures and video clips of rivers bursting their banks, inundating homes, businesses and farmers’ fields with brown murky water, and Storm Bert provided widespread examples.
Who and what was storm Bert?
Storm Bert was a depression (otherwise commonly known as a low pressure system, extra-tropical depression or mid-latitude cyclone) that brought extremely wet weather to the UK between the 22nd to 25th November 2024, particularly to SW England and South Wales. Around three quarters of the whole-month average rain fell in a swathe from Gwent to Wiltshire to Northamptonshire in three days.
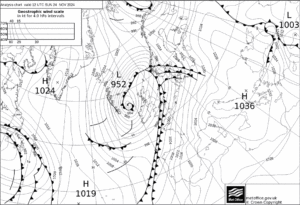
Figure 1 – Synoptic chart from the 24th November, showing the passage of fronts over the UK. © Crown copyright, Met Office
Storm Bert transported warm tropical maritime air from over the Atlantic towards the UK. Bert then pushed a series of weather fronts across the UK on the 23rd and 24th November (Figure 1). The boundary between the cold polar air ahead and the warm tropical marine air pushing in off the Atlantic is known as the warm front, and as it moved over the UK there was an impressive temperature gradient between the west and the east. The tight temperature gradient on the warm front can be seen in the following temperature readings taken at the Reading University’s Atmospheric Observatory:
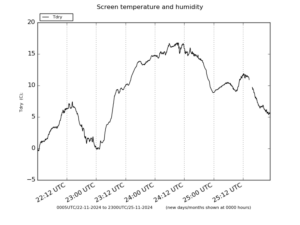
Figure 2 – Timeseries of the temperature during the passing of Storm Bert. 'Courtesy of Department of Meteorology, University of Reading. https://www.reading.ac.uk/meteorology/
In figure 2, you can see temperatures increase from around freezing to over 15 degrees in one day.
Due to the slow-moving nature of these fronts, the precipitation was persistent and extensive, particularly across England and Wales (Figure 3). Some precipitation fell as snow over central and Northern Wales, central and northern England and parts of Scotland.
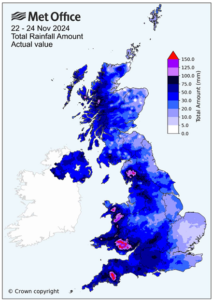
Figure 3 – Total rainfall amount during the passage of Storm Bert. © Crown copyright, Met Office
This storm was forecast well in advance, and a range of warnings issued. The Met Office named Bert on the 21st November, and issued amber warnings for the snow and ice and yellow warnings for wind and rain. These warnings were accompanied by numerous flood warnings issued from the Environment Agency and Natural Resources Wales.
Impacts of Storm Bert
Bert caused severe flooding, directly inundating more than 500 homes and businesses in England and Wales. A shocking video of a tractor driving through the flood waters in Tenbury Wells went viral. Flooding in Pontypridd, a town in South Wales, occurred when the River Taff broke its banks, then taking a detour through the centre of the town and bombarding homes and businesses. The river Taff flows south through the town, with surrounding streets being categorised at a medium or low risk from river flooding. Ahead of the storm (22nd November), the water level sat well within the a ‘typical range’ (Figure 4), however by 5.45pm the next day the river peaked for a short time at 2.6m, before then peaking again at 4.42m on the morning of the 24th November.
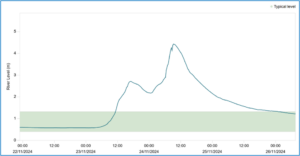
Figure 4 – Timeseries of the river level at Taff at Pontypridd, taken from Natural Resource Wales. https://rivers-and-seas.naturalresources.wales/Station/4061?parameterType=1
The scale of this flooding caused much outrage from local people. Pontypridd has experienced a series of significant flooding events in recent years. Storm Dennis in 2020 produced an £80 million bill for the Rhondda Cynon Taff council, the council in which Pontypridd is situated. Following the flood, the Welsh government provided £1.1 million for the repairs to damaged flood protection measures in Rhondda Cynon Taff. This included repairing the 400m and 300m of flood defences along the eastern and western banks of the Taff in Pontypridd, ensuring it still met the standard level of protection required to protect against 1 in 100 year flood events.
However, the repeated nature of such heavy rain events and consequent flooding raises questions regarding the suitability of the current flood defences, and the true benefit of financing the ‘patching up’ of defences. Instead, we need to improve our adaptation methods (in this case build longer, higher and stronger river defences) to better prepare ourselves for flooding events, particularly in a warming climate where rain rates associated with mid-latitude cyclones, like Bert, are forecast to increase.
What changes are we adapting to?
Common inaccuracies in the knowledge of school students have been identified relating to the impacts of climate change, and these are being perpetuated through some school resources.
So, what exactly are we adapting to? Taken from the latest IPCC report there are key headlines for the UK and the weather events we experience. I encourage you to keep an eye out for any inaccuracies in the sources you come across.
What we know and can expect in a changing climate:
• Flooding and drought events will continue to become more frequent.
• With climate change/global warming – near-surface atmospheric moisture capacity increases 7% per 1 degree of warming, driven by higher evaporation rates. (Try to avoid talking about this in reference to how much water the ‘air can hold’).
• Rainfall rates in extra-tropical cyclones will increase with a warming climate (therefore we can expect higher precipitation accumulations from the storms we experience. Like Storm Bert).
Common mistakes that need addressing:
• The UK is experiencing more storms
o This is not true! Scientist currently have low confidence in the evidence that more extratropical cyclones are hitting the UK
• The UK is experiencing a change in our storms due to a poleward shift in the extra-tropical jet (referred to as the ‘jet stream’)
o This is wrong. The jet stream in the Southern Hemisphere has shifted poleward, meanwhile no trend has been identified in the location of the Atlantic jet stream in the Northern Hemisphere.
• The number of Tropical cyclones is increasing
o This is not true. Currently there is no evidence to support an increasing trend in in overall number of tropical cyclones each year.
o However the proportion of major (Category 4 and 5) tropical cyclones appears to be increasing. Rainfall rates and peak wind speeds associated with Tropical cyclones are also increasing in a warmer world.
In order to adapt to a warming globe and the subsequent changing climate, such as the increasing frequency of flooding events, the human population will need to use a variety of adaptation methods. Support for places with less financial stability (often the countries that are inadvertently impacted by climate change, yet have contributed the least to greenhouse gas emissions) is necessary. The finance of adaptation was a contentious topic at the latest COP meeting, COP29, in Azerbaijan. The New Collective Quantified Goal (NCQG) is the goal that $300 billion (or ~ £240 billion) per year will be raised (by 2035) to support adaptation measures needed across the globe and particularly for developing countries. Although not anywhere near the estimated funding needed, it is a starting point.
A full version of this Guest Blog can be found here. It includes discussion of the meaning of the terms adaptation and mitigation, the importance of early warning systems for floods and storms and several links to relevant resources and articles for further study.
About the author:
 Eleanor Pinches works in the education team at the Royal Meteorological Society, following on from a career in weather forecasting. She was first drawn to pursuing an education and career in meteorology following the cold winter of 2009/2010, named the ‘Big Freeze, and experiencing ‘Thunder Thursday’ in Newcastle which caused severe localised flooding. The Society’s work supports the education of weather and climate in schools. Eleanor hopes to pass on the enthusiasm and invaluable knowledge to current and future students.
Past guest blogs:
Past guest blogs from previous months can be found under "News: categories - past guest blogs", or by following this link https://www.geographysouthwest.co.uk/category/past-guest-blogs/